E-commerce funnel metrics help you understand where customers are dropping off between seeing an advertisement and completing a purchase.
That matters because when sales are lower than expected, the answer is not automatically to increase your advertising budget.
Sometimes the advertisement is doing its job.
Sometimes people click but never properly reach the website.
Sometimes they reach the product page but do not add anything to their cart.
Sometimes they add a product to their cart but never start checkout.
Sometimes they reach checkout but do not complete the purchase.
And sometimes the sales are happening, but the business still is not making enough money.
If you only look at the final sales number, you miss everything that happened before it.
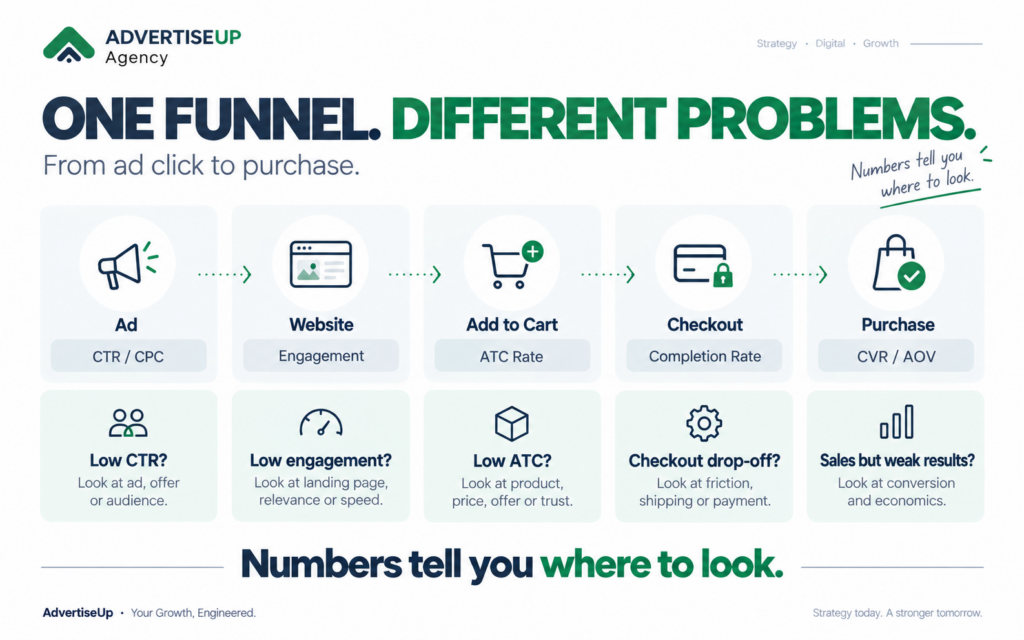
I prefer to look at the customer journey as a simple funnel:
Ad → Website → Add to Cart → Checkout → Purchase → Profit
Each stage answers a different question.
And each stage has different numbers that tell us where we should investigate next.
The objective is not to become obsessed with dashboards.
It is to understand what your numbers are actually telling you.
Numbers don’t tell you what to do. They tell you where to look.
Why You Shouldn’t Judge Your Funnel by Sales Alone
Imagine two e-commerce businesses.
Both generated 100 purchases this month.
At first glance, they appear to have achieved the same result.
But the first company may have needed 20,000 website sessions to generate those orders.
The second may have needed only 5,000.
One might have excellent advertising but a poor website conversion rate.
The other could have an excellent website but expensive customer acquisition.
One could have strong revenue while losing money after discounts, shipping and returns.
So when somebody tells me:
“My advertising isn’t working.”
I want to understand what “not working” actually means.
Are people not clicking?
Are they clicking but failing to reach the website?
Are they visiting but not showing interest in the product?
Are they adding products to cart but abandoning before checkout?
Are they reaching checkout but failing to pay?
Or are they purchasing while the economics still don’t make sense?
Those are not one problem.
They are several completely different problems.
Let’s work through the funnel step by step.
1. Ad to Website: Are You Generating Real Interest?
The first stage of the funnel is straightforward:
Someone sees your advertisement and decides whether it is worth clicking.
At this stage, I normally look at four numbers:
- CPM
- Outbound CTR
- CPC
- Landing Page Views
They answer different questions.
CPM: How Expensive Is It to Reach Your Audience?
CPM means cost per thousand impressions.
It tells you how much you are paying for every 1,000 times your advertisement is shown.
The simplified formula is:
CPM = Advertising Spend ÷ Impressions × 1,000
CPM is useful because it tells you how expensive access to the audience currently is.
But a high CPM does not automatically mean you have a bad campaign.
The cost can change because of:
- competition
- seasonality
- audience size
- location
- placement
- campaign objective
- industry
- creative quality
For example, advertising during a highly competitive sales season can become more expensive even if nothing about your business changed.
This is why I prefer using CPM as a diagnostic signal, rather than treating it as a pass-or-fail score.
Where to find CPM
You can find it inside Meta Ads Manager by adding CPM to your reporting columns.
Outbound CTR: Are People Interested Enough to Click?
CTR means click-through rate.
But Meta can show several types of clicks, which is why I normally care more about Outbound CTR when the objective is to send someone to a website.
Outbound CTR focuses on the proportion of impressions that resulted in somebody clicking away from Meta toward an external destination.
The simplified formula is:
Outbound CTR = Outbound Clicks ÷ Impressions × 100
It answers a useful question:
“Are people who see this advertisement interested enough to take the next step?”
A weak CTR may give you a reason to investigate:
- the creative
- the offer
- the audience
- the product
- the hook
- the message
But notice the wording:
investigate.
A low CTR does not automatically prove that your creative is bad.
Metrics point us toward a problem. They do not diagnose it for us.
For context, WordStream’s 2025 dataset reported an average 1.71% CTR for Meta traffic campaigns, but individual industries varied significantly—from below 1% in some categories to more than 4% in others.
That is exactly why benchmarks should be treated as references rather than universal targets.
Where to find Outbound CTR
Meta Ads Manager → Customize Columns → Outbound CTR
CPC: What Are You Paying for the Click?
CPC means cost per click.
Its basic calculation is:
CPC = Advertising Spend ÷ Clicks
CPC helps you understand how expensive it is to generate traffic.
But cheap traffic is not necessarily good traffic.
Imagine one campaign generates clicks for EGP 2.
Another generates them for EGP 5.
The EGP 2 campaign looks better until you discover almost nobody from that traffic purchases.
Meanwhile, the EGP 5 traffic converts extremely well.
So CPC only becomes meaningful when you connect it to what happens after the click.
WordStream’s 2025 data put average CPC for Meta traffic campaigns at around $0.70 across its sample, but the data was US-based and varied widely by industry.
For an Egyptian or UAE business, your own historical performance is normally a more useful benchmark than blindly comparing yourself with a US-dollar industry average.
Where to find CPC
Meta Ads Manager → Customize Columns → CPC / Cost per Outbound Click
Landing Page Views: Did the Click Actually Become a Visit?
This is one of the funnel numbers businesses often overlook.
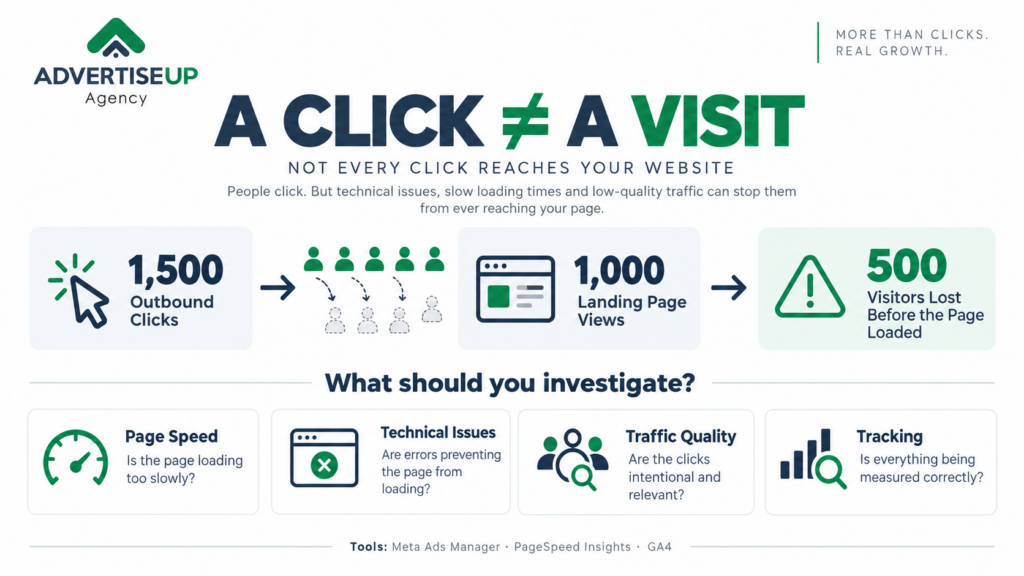
A click does not necessarily mean somebody successfully reached your website.
Imagine this:
1,500 people click the advertisement.
But only:
1,000 landing page views are recorded.
You have already lost 500 people before they properly experienced the website.
That gap deserves investigation.
Possible causes include:
- slow page loading
- users abandoning before the page finishes loading
- technical errors
- poor-quality or accidental clicks
- tracking issues
- device or browser problems
This is why I like comparing Outbound Clicks with Landing Page Views.
A useful calculation is:
Landing Page View Rate = Landing Page Views ÷ Outbound Clicks × 100
There is no universal percentage that every business should achieve.
The value is in noticing when the difference becomes unusually large.
Where to look
Use:
Meta Ads Manager for outbound clicks and landing page views.
Then use tools such as Google PageSpeed Insights when the numbers suggest loading or technical problems.
2. Website Engagement: They Clicked, but Did They Stay?
Now the advertising has done its job.
The customer has reached the website.
The question changes.
We are no longer asking:
“Did the advertisement get attention?”
We are asking:
“What happened after the customer arrived?”
This is where engagement metrics become useful.
Engagement Rate
Google Analytics 4 defines an engaged session as one that:
- lasts longer than 10 seconds,
- includes a key event,
- or contains at least two page or screen views.
Engagement rate tells you the percentage of sessions that meet one of those conditions.
If people consistently arrive and fail to engage, you may need to investigate:
- whether the landing page matches the advertisement
- page speed
- mobile usability
- confusing navigation
- irrelevant traffic
- weak product presentation
- poor messaging
Where to find it
Google Analytics 4
Bounce Rate
In GA4, bounce rate is effectively the opposite of engagement rate: it represents sessions that were not engaged.
Bounce rate is useful, but I would never diagnose a website using bounce rate alone.
Someone leaving quickly tells you that something may deserve attention.
It doesn’t tell you why.
That’s where behavioural tools become valuable.
Where to investigate further
Use Microsoft Clarity for:
- session recordings
- heatmaps
- behavioural patterns
- repeated clicks
- navigation problems
Analytics helps tell you where something unusual is happening.
Watching actual behaviour can help you understand why.
3. Product to Add to Cart: Did They Actually Want It?
A visitor reached your store.
They saw the product.
Now we reach one of the most useful e-commerce funnel metrics:
Add-to-Cart Rate
At a simple store level:
Add-to-Cart Rate = Sessions With Cart Additions ÷ Total Sessions × 100
The purpose of this metric is not simply to chase a higher percentage.
It helps answer:
“Are visitors showing meaningful purchase intent?”
Imagine you have strong traffic.
People reach your product pages.
But very few add anything to their cart.
That is where I would start investigating:
- the product
- pricing
- the offer
- product images
- product videos
- product information
- reviews
- trust
- sizing information
- available variants
- delivery expectations
Again, a low add-to-cart rate does not automatically mean:
“The product is bad.”
It means the customer is reaching the buying environment but isn’t taking the next meaningful step.
For directional context, Littledata’s benchmark data reports an average Shopify add-to-cart rate of around 4.6%, with substantial variation by category.
Treat that as orientation—not a target your business must hit.
Where to find it
Depending on your setup:
Shopify Analytics
WooCommerce reporting
GA4 → add_to_cart event
Microsoft Clarity can again help you investigate behaviour around the product page.
4. Cart to Checkout: They Want It. What Stopped Them?
Adding something to a cart is a stronger signal.
The customer has effectively told you:
“I’m interested in buying this.”
But interest is not the same as completing the purchase.
Now I want to know:
How many cart users continue to checkout?
You can think of this as:
Checkout Starts ÷ Cart Additions × 100
If many users add products to their cart but fail to continue, I would investigate:
- shipping costs
- delivery expectations
- cart complexity
- unexpected fees
- minimum order rules
- unavailable products or variants
- weak trust signals
- coupon-code distractions
- forced account creation
Cart abandonment itself is normal.
Baymard currently calculates an average documented online shopping cart abandonment rate of approximately 70.22% across 50 studies.
That does not mean you should accept 70% as your goal.
It tells us something more useful:
Cart abandonment is widespread, and not every abandoned cart represents a failure you could have prevented.
Some customers are simply browsing or comparing prices.
The job is to identify the abandonment that is avoidable.
Where to find it
Use:
Shopify / WooCommerce
GA4 → add_to_cart + begin_checkout
Microsoft Clarity
5. Checkout to Purchase: They Started Checkout. Why Didn’t They Buy?
Now we reach one of the most valuable parts of the funnel to diagnose.
The customer didn’t just browse.
They didn’t just like the product.
They started checkout.
That demonstrates significantly stronger intent.
Checkout Completion Rate
A simple calculation is:
Checkout Completion Rate = Purchases ÷ Checkout Starts × 100
If customers consistently start checkout without completing the order, I want to investigate things such as:
- failed payments
- missing payment methods
- unexpected final costs
- shipping fees
- unclear delivery times
- checkout errors
- form problems
- technical problems
- lack of trust
Littledata’s directional Shopify benchmark puts average checkout completion at around 45%. Again, category, audience and setup matter, so use this as a reference rather than a universal target.
Don’t Ignore Your Payment Gateway
Your website analytics may tell you that someone reached checkout.
Your payment provider can tell you something different:
What happened when they tried to pay?
Look at:
- successful transactions
- failed transactions
- declined cards
- abandoned payment attempts
- authentication problems
- failure codes
This is especially important when you suddenly see checkout performance change without an obvious website reason.
Where to look
Use:
Shopify / WooCommerce
GA4
Your payment gateway
The exact gateway might be Paymob, Stripe, or another provider depending on your business.
6. Purchase to Profit: You Made the Sale. Are You Actually Making Money?
This is where I think many dashboards stop too early.
They celebrate the purchase.
But the business does not survive on purchases.
It survives on healthy economics.
Now I want to look at another group of numbers.
E-Commerce Conversion Rate
Conversion rate tells you what percentage of website visits ultimately became purchases.
The basic formula is:
Conversion Rate = Orders ÷ Website Sessions × 100
This is probably one of the most commonly quoted e-commerce funnel metrics.
And also one of the most frequently misunderstood.
Shopify’s current 2026 guide illustrates just how much conversion rates differ by category. Recent global datasets range around 1.4% to 2.66% overall, while Shopify cites category benchmarks ranging from below 1% in luxury and jewellery to above 5% in pet care.
So asking:
“Is a 2% conversion rate good?”
without knowing what you sell is not particularly useful.
Compare yourself with:
- your industry
- your price point
- device type
- traffic source
- new versus returning visitors
- your own historical performance
Average Order Value
Average Order Value—or AOV—answers:
“How much revenue does an average order generate?”
The calculation is:
AOV = Revenue ÷ Number of Orders
AOV can help you assess:
- bundles
- upsells
- cross-sells
- free-shipping thresholds
- product mix
- promotional strategy
There is no useful universal AOV benchmark.
A jewellery business and a grocery delivery business shouldn’t have the same target.
Your own margins and economics matter more.
Customer Acquisition Cost
Customer Acquisition Cost asks:
“What did it actually cost to acquire a new customer?”
A simplified calculation is:
CAC = Acquisition Spend ÷ New Customers
This starts moving us beyond advertising metrics and into business economics.
CPC tells you what a click cost.
CAC tells you what a customer cost.
Those are very different questions.
ROAS
ROAS tells you how much attributed revenue your advertising produced relative to advertising spend.
ROAS = Attributed Revenue ÷ Advertising Spend
ROAS is useful.
But:
ROAS is not profit.
You can have a very impressive ROAS while still having weak economics after accounting for:
- cost of goods
- discounts
- shipping
- fulfilment
- returns
- payment fees
- agency or marketing costs
- operational overhead
This is one of the reasons I don’t like diagnosing a business from an advertising dashboard alone.
A successful ad campaign and a healthy business are related.
But they are not the same thing.
Which Tools Should You Use to Track Your E-Commerce Funnel?
You don’t need fifteen analytics platforms.
For most businesses, I would start with a handful of tools that answer different questions.
Meta Ads Manager
Use it to understand:
- CPM
- outbound CTR
- CPC
- landing page views
- advertising spend
- attributed advertising results
It answers:
“What is happening with the advertising?”
Google Analytics 4
Use GA4 to understand:
- sessions
- traffic sources
- engagement
- product behaviour
- cart events
- checkout events
- purchases
It answers:
“What happens after people arrive?”
Shopify or WooCommerce
Your commerce platform can help you understand:
- store sessions
- product performance
- cart activity
- checkout starts
- orders
- conversion rate
- average order value
It answers:
“What is actually happening inside the store?”
Microsoft Clarity
Clarity provides:
- session recordings
- heatmaps
- behavioural signals
It can help answer:
“Why are visitors behaving this way?”
Your Payment Gateway
Your payment provider helps you understand:
- attempted payments
- successful payments
- declines
- failures
- payment-method performance
It answers:
“What happened at the moment the customer tried to pay?”
How to Diagnose an E-Commerce Funnel Without Getting Lost in Data
Let’s make this practical.
Imagine:
100,000 people see an advertisement.
2,000 click.
1,400 reach the website.
300 add something to cart.
150 begin checkout.
75 purchase.
Don’t immediately focus on the fact that you generated 75 orders.
Work backwards.
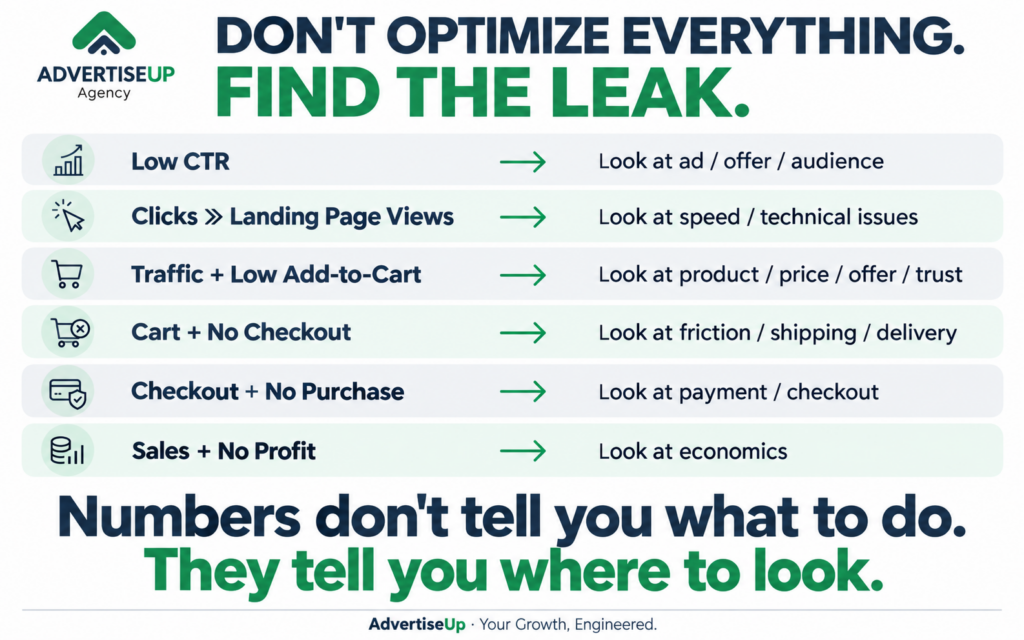
If impressions are high but clicks are weak
Investigate:
Ad → offer → audience → creative
If clicks are high but landing page views are much lower
Investigate:
Speed → technical issues → tracking → traffic quality
If people reach the website but add-to-cart activity is weak
Investigate:
Product → price → offer → content → trust
If customers add to cart but don’t begin checkout
Investigate:
Cart friction → shipping → delivery → unexpected conditions
If customers begin checkout but don’t purchase
Investigate:
Payment → checkout errors → final costs → delivery options
If purchases happen but profit is weak
Investigate:
Margins → CAC → discounts → shipping → returns → business economics
Suddenly, the numbers are no longer just numbers.
They’re a map.
E-Commerce Benchmarks Are Useful — but They Are Not Your Target
This is important enough to repeat.
You will find endless posts online saying:
“Your CTR should be X.”
“Your conversion rate should be Y.”
“Your add-to-cart rate must be Z.”
Real businesses don’t work that neatly.
Benchmarks change based on:
- country
- category
- product price
- purchase frequency
- traffic source
- audience intent
- mobile versus desktop
- brand recognition
- seasonality
Use benchmarks to identify unusual patterns.
Don’t use them to replace judgement.
In many situations, your most valuable benchmark is:
your own performance over time.
Did CTR suddenly fall?
Did your conversion rate improve after fixing the product page?
Did checkout completion drop after introducing a new payment system?
Did AOV increase after introducing bundles?
Those comparisons can be far more valuable than asking whether your store matches an internet average.
Understand Your Numbers, Then Investigate the Problem
The objective isn’t to spend your life staring at dashboards.
The objective is to stop guessing.
If your advertising isn’t generating clicks, investigate the advertisement.
If people click but don’t reach the website, investigate the transition.
If they reach the website but show no purchase intent, investigate the product and offer.
If they add to cart and disappear, investigate the experience.
If they reach checkout but don’t pay, investigate checkout and payment.
And if they purchase but the business still isn’t making money, investigate the economics.
That’s what good analytics should do.
It should make the next question clearer.
Numbers don’t tell you what to do. They tell you where to look.
Frequently Asked Questions About E-Commerce Funnel Metrics
What are the most important e-commerce funnel metrics?
The most useful metrics depend on which stage you are analysing, but a strong starting set includes CPM, outbound CTR, CPC, landing page views, engagement rate, add-to-cart rate, checkout-start rate, checkout completion rate, conversion rate, AOV and customer acquisition cost.
What is a good e-commerce conversion rate?
There is no universal good conversion rate. Current benchmark datasets vary significantly by category, traffic source and customer behaviour. Shopify’s 2026 guide shows global averages around 1.4%–2.66%, while category averages range considerably above and below those figures.
What does a low add-to-cart rate mean?
A low add-to-cart rate suggests visitors are reaching the store but relatively few are showing strong purchase intent. That gives you a reason to investigate the product, pricing, offer, content, trust, availability and product-page experience.
Why do I have more link clicks than landing page views?
A customer can click an advertisement but abandon the journey before the page fully loads. A large gap may justify investigating loading speed, technical issues, tracking or traffic quality.
Why are customers adding products to cart but not buying?
There can be several reasons, including shipping costs, delivery expectations, cart or checkout friction, payment problems, missing payment methods or unexpected final costs. Cart abandonment is common—Baymard’s current aggregated benchmark is approximately 70.22%—so the goal is to identify the portion of abandonment your business can realistically improve.
Does a good ROAS mean my business is profitable?
No. ROAS compares attributed advertising revenue with advertising spend. It does not automatically account for cost of goods, discounts, shipping, returns, fulfilment, payment fees or other operating expenses.